.png)
Wishlist data is probably the most underused tool in the average Shopify merchant’s analytics stack. No, not because it is hard to access, but because most stores install a wishlist app, see that the heart button is getting clicks, and leave it at that.
The dashboard, meanwhile, is sitting there with six data points that tell you which products have confirmed demand, which customers are closest to buying, and where your conversion funnel is losing people who already want to spend money in your store.
The gap between “customer saved a product” and “merchant took action” is exactly where a lot of Shopify stores leave real money on the table.
This blog walks you through what the Flits Wishlist Analytics dashboard actually shows you, how to interpret each metric without overthinking it, and what kinds of decisions you can confidently make with that data.
Why Wishlist Analytics is More Than a Vanity Metric
It is easy to push wishlist analytics toward the bottom of your reporting checklist. You already have your Shopify sales data, your email open rates, your ad spend returns, and a dozen other numbers competing for your attention. Wishlist stats can feel supplementary.
That framing undersells what wishlist data actually is: leading indicators. The kind of behavioral signal that tells you what is about to happen before it shows up in your revenue numbers.
Standard sales reports are retrospective. They tell you what has already sold. Wishlist analytics tells you what customers want before they have committed to buying it.
That is genuinely different information, and for merchants who plan inventory, build email campaigns, or design promotional calendars, it is one of the most useful inputs you can have.
When a customer saves a product, they are making a low-stakes commitment. Not the passive kind that comes from a page view, and not the high-commitment kind that comes with an add-to-cart.
Wishlist saves occupy that middle ground where purchasing decisions are actually forming. If you can read that data and act on it, you are working with intent, which converts at a completely different rate than cold traffic.
The Flits Wishlist Dashboard: All Six Metrics Explained
The Flits Wishlist Analytics dashboard organizes performance data into six core metrics. You can filter by today, this month, or a custom date range, and the dashboard automatically compares the selected window against the previous period so you can see whether things are moving in the right direction.
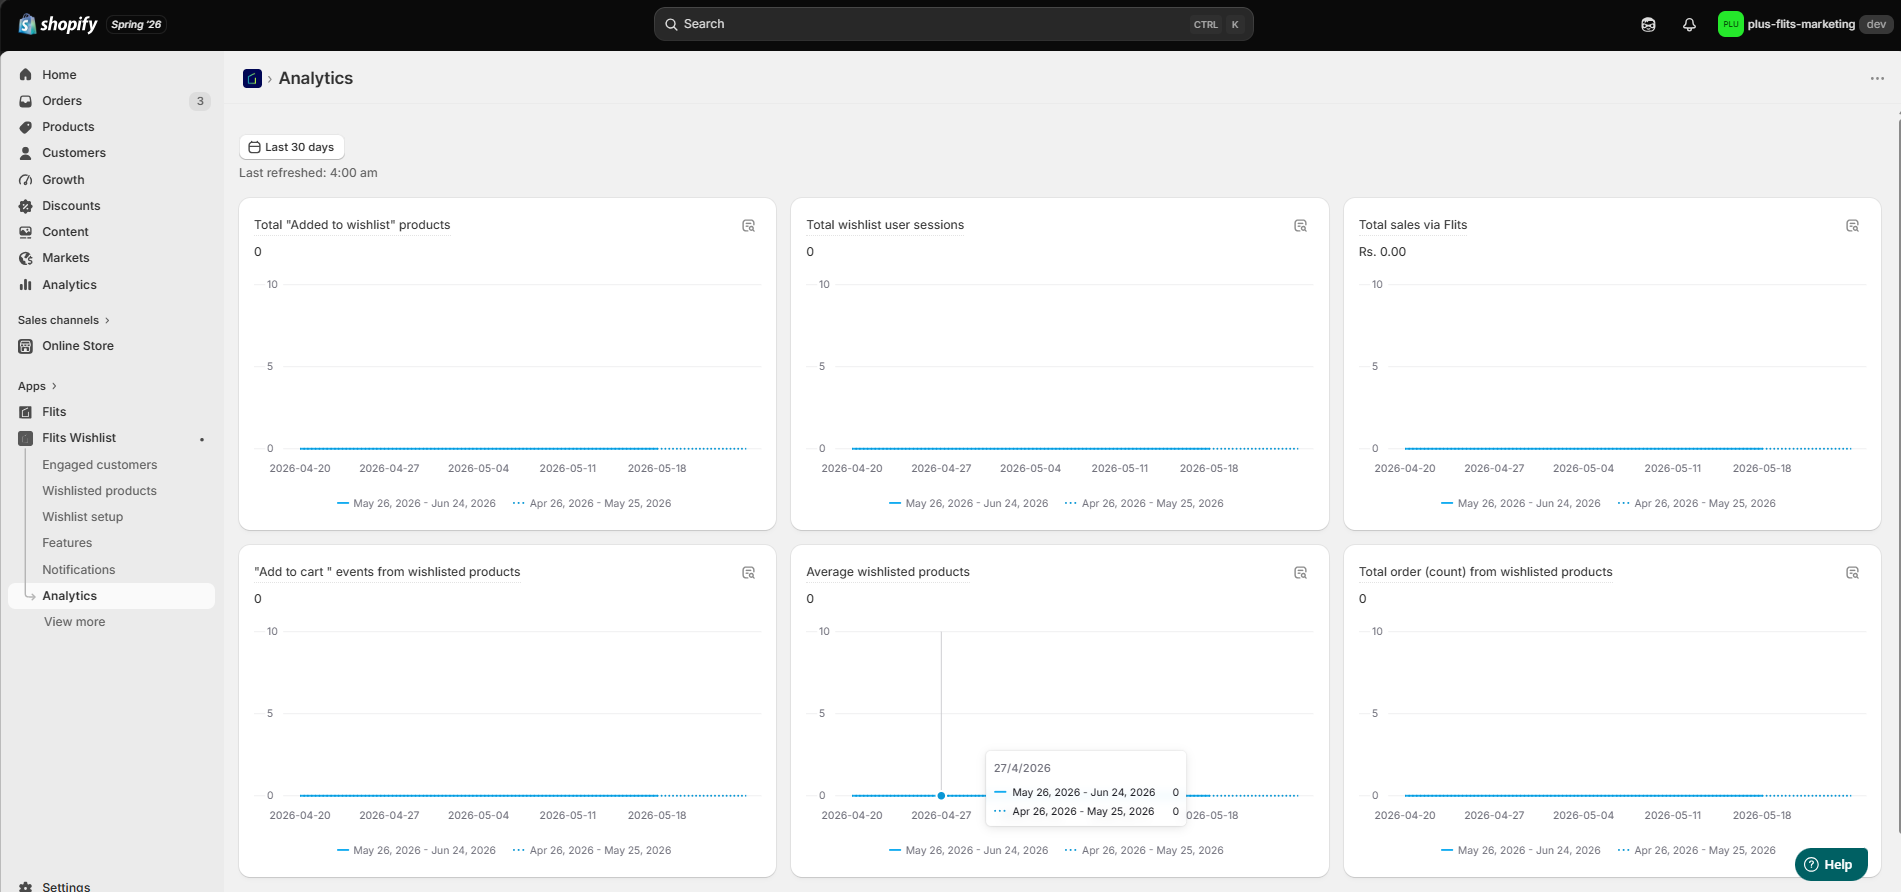
Here is what each metric is actually measuring and why it matters.
1. Total "Added to Wishlist" Products
This is the running count of products customers have saved during the selected period. As a top-level number, it gives you a sense of general engagement. But the more useful question is: which specific products are collecting the most saves?
Cross-reference this with your sales performance. Products with high wishlist counts and healthy purchase rates are doing well across the board. Products with high wishlist counts and flat sales are sending a signal worth investigating.
The issue might be pricing, a recurring stockout, or the fact that those products are not showing up in any of your promotional emails. Each of those is something you can fix, once you know the pattern exists.
2. Total Wishlist User Sessions
These are the sessions in which at least one wishlist interaction happened, whether a customer added something, removed an item, or moved a product to the cart. Think of it as your activity indicator: how often are customers actually engaging with their wishlists, not just creating them and forgetting they exist?
Sessions trending upward are a reliable sign that your wishlist feature is visible, accessible, and actually being used. A sudden drop is worth looking into.
A theme update or an app conflict can sometimes cause the wishlist button to become less visible across product and collection pages, and the analytics will catch it before your customer complaint queue does.
3. Total Sales via Flits
This is the revenue from customers who interacted with their wishlists before making a purchase. In other words, wishlist-influenced revenue is expressed in actual monetary terms.
This metric is the financial case for the feature. When it is growing, you have evidence that wishlist activity is pulling purchases forward.
When it is flat or declining while your save count is still climbing, you have a conversion gap worth addressing. A well-timed email campaign, a price drop notification, or a back-in-stock alert targeted at customers who have wishlisted specific products is usually what closes that gap.
4. "Add to Cart" Events from Wishlisted Products
This tracks how often customers move an item from their wishlist directly into their cart. It is one concrete step closer to purchase than a save, and it gives you a practical picture of how often your wishlist is functioning as a pre-purchase staging area rather than just a bookmarking tool.
When this number is strong relative to your total saves, your wishlist is actively moving customers through the funnel. When it is low, something is interrupting the path from wishlist to checkout.
Common culprits include out-of-stock products that cannot be added to cart, a clunky mobile experience, or simply a lack of follow-up communication reminding customers to come back.
5. Average Wishlisted Products
This is the average number of items per wishlist across your customer base. A higher average generally means customers are using their wishlists as a real browsing and planning tool, not just clicking a heart button once and forgetting the feature exists.
If this number is lower than you would like, it is often a placement issue. Customers are not encountering the wishlist option at the natural moments in their shopping journey.
Adding the wishlist button to collection pages, the shopping cart, and the account profile section alongside product pages tends to raise this metric and give you richer behavioral data to work with.
6. Total Order Count from Wishlisted Products
This is the number of orders that included at least one item previously saved to a wishlist. Think of it as your conversion volume metric. How many purchase transactions actually involved a product someone had already saved?
When this grows consistently, your wishlist is working as a retention and conversion tool, not just a feature that lives on your product page. You can use this number internally to make the case for wishlist-related campaigns and to anchor budget decisions around the feature.
Using the Date Filters Properly
The dashboard gives you three filter options: today, this month, and a custom date range. The comparison view sits underneath each chart, showing you the previous equivalent period.
A few ways to make this work harder for you:
- Run the 30-day view ahead of any major sale to see which products have been building wishlist saves most recently. Those are the items your customers are most primed to buy.
- Run a custom range across your last peak season and compare it to the current year to spot demand trends before they fully materialize in purchase data.
Turning Dashboard Data Into Actual Decisions
Reading the metrics is step one. Knowing what to do next is where the return on the feature actually comes in.
1. High Save Count with Low Conversion
You already have a campaign brief.
When a product is accumulating saves but is not converting at the rate you would expect, you have everything you need for a targeted promotion.
A discount or a time-sensitive offer sent specifically to customers who saved that item will outperform a general site-wide sale on the same product by a significant margin. The audience is pre-qualified. They already told you they want it.
You can also send personalized offers or discounts to customers who have shown interest in a product. A price reduction, even a modest one, can be enough to prompt a purchase from someone who was already on the fence.
2. Use Wishlist Volume for Inventory Planning
Your top-wishlisted products have confirmed demand behind them, not predicted demand, actual behavioral confirmation that customers want to buy.
That makes them the items you need in stock, especially before peak seasons, promotional events, or any time you are expecting elevated traffic.
Wishlist data functions the same way that add-to-carts and page views do as leading demand signals, but it is often more deliberate because the customer actively chose to save the item.
Running out of a heavily wishlisted product right when your sale campaign goes live is one of the more avoidable revenue losses in e-commerce.
On the flip side, if a top-wishlisted product just came back in stock, a back-in-stock notification sent to everyone who saved it is one of the highest-converting messages you can send. The audience already told you they want it. You are simply letting them know it is available again.
3. Reach Your Highest-Intent Customers First
The most engaged customers in your dashboard, the ones with the highest wishlist activity across saves, removals, and cart events, are your warmest leads. They came back. They interacted with their lists. They are actively considering purchasing.
This is your most efficient conversion audience. Reaching them with a personalized message tied to something they have actually saved tends to convert well because it feels relevant and specific rather than random.
For brands where customer relationships matter, this list is also a useful starting point for personal outreach: a brief, specific email acknowledging what someone has been saving can be more effective than any automated flow.
4. Time Promotions Around Intent, Not Just Calendar Dates
Most promotional calendars are built around external triggers: holidays, paydays, seasonal events. Wishlist data gives you an internal trigger to layer on top of those: which products have been building the most intent in the weeks leading up to your sale?
Looking at your top-wishlisted products from the 30 to 60 days before a promotional event and featuring those prominently in your sale emails and on your homepage during the campaign period is a practical way to put the data to work. Customers who have already saved those products are primed to respond.
5. Viewing Individual Customer Wishlists in the Admin Panel
The dashboard gives you aggregate performance data. But Flits also allows you to look at individual customer wishlists directly from your Shopify admin panel, which opens up a different kind of insight.
When you can see exactly what a specific customer has saved, you can personalize your service conversations, your loyalty program touchpoints, and your outreach in ways that aggregate data cannot support.
A customer with seven items saved across three product categories is giving you a clear picture of their preferences.
For brands in fashion, jewelry, beauty, home goods, or any category where personal recommendations matter, that information has practical value every time you engage with that customer.
This view pairs well with a loyalty or VIP program. Knowing what a high-value customer wants before they buy it creates room for proactive engagement that feels genuinely personal rather than automated.
A Few Dashboard Patterns Worth Watching
- Wishlist sessions are climbing while sales stay flat: This usually means customers are engaging with the feature, but something is interrupting the path from wishlist to purchase. An automated email flow triggered by wishlist inactivity, or a simple reminder campaign, is often what restores the conversion rate.
- A heavily wishlisted product with declining stock: Act on this before it becomes an out-of-stock situation. Prioritize the restock and prepare a notification for customers who saved it. The conversion window, once a product comes back in stock, is narrow, and it closes fast.
- Seasonal spikes in wishlist saves before a gifting period: This is an early demand signal, the kind that gives you time to act. If saves on specific products start climbing ahead of big occasions such as Diwali, Christmas, or Valentine's Day, those products belong in your pre-sale campaign, not just your sale.
Wishlist Data Works Best When the Feature Is Visible Everywhere
The quality of your analytics depends directly on how much wishlist activity you are capturing. If the save button only appears on product pages, you are seeing a fraction of the possible engagement.
Flits surfaces the wishlist feature across your navigation menu, collection pages, product pages, shopping cart, and account profile area.
Making the feature accessible at each of these touchpoints gives customers more opportunities to save at natural moments in their browsing journey.
More saves means richer data, and richer data means better decisions on campaigns, inventory, and customer outreach.
Frequently Asked Questions
1. What is wishlist-influenced revenue in Shopify?
Wishlist-influenced revenue tracks the revenue generated by customers who saved a product to their wishlist before purchasing it. It is a way to quantify how directly wishlist activity contributes to conversions, rather than treating saves as engagement that does not connect to sales.
2. How often should I check my wishlist analytics dashboard?
A weekly review of session trends and top-wishlisted products is usually enough for most stores. Check more frequently ahead of sale periods or promotional campaigns, when the data can inform real-time decisions about what to feature and what to stock.
3. Can I see what specific customers have saved using Flits?
Yes. Flits allows you to view and manage individual customer wishlists directly from your Shopify admin panel, in addition to the aggregate dashboard metrics. This is useful for personalized outreach, customer service, and loyalty-based campaigns.
Start With the Dashboard You Already Have
If Flits Wishlist is set up in your store, the data is there.
Open the Analytics section in the app and start with Total Sales via Flits and your top-wishlisted products. Those two views together will tell you whether your wishlist is driving conversions and which products deserve attention in your next campaign.
If you are not yet using Flits Wishlist, you can explore it on the Shopify App Store or reach the Flits team at support@getflits.com or book a demo to see how it fits your store setup.
Your customers are already leaving intent signals across your catalog. Wishlist analytics is how you start reading them.