%201.png)

Asune (asune.jp) is a Japanese skincare brand produced by Aya Nakamachi, built around making it simple and accessible to address everyday skin concerns. The product line spans cleansers, toners, serums, creams, and sheet masks, sold directly to consumers.
BFCM brings a wave of new and deal-driven shoppers, but that wave doesn't always translate into long-term customers. A large share of BFCM buyers place one order for a discount and never return. For a loyalty program, the real test isn't whether it can handle the traffic spike. It's whether the customers who show up during the sale come back afterward.
The question for Asune's BFCM data: did the loyalty program simply process a bigger crowd of one-time buyers, or did it convert BFCM shoppers into customers who returned in December to spend the points they'd earned?
Asune runs on Flits' Established plan, the top tier, with custom configuration built around their store. The plan includes VIP tiers with unlimited levels, 40+ integrations, push-notification campaigns, bonus and bulk points, and Shopify POS support, in addition to the core points-earning and redemption program this study measures.
Flits pulled order and redemption data across Asune's BFCM period, October through December 2025, to see how loyalty activity moved through the sale and into the month after.
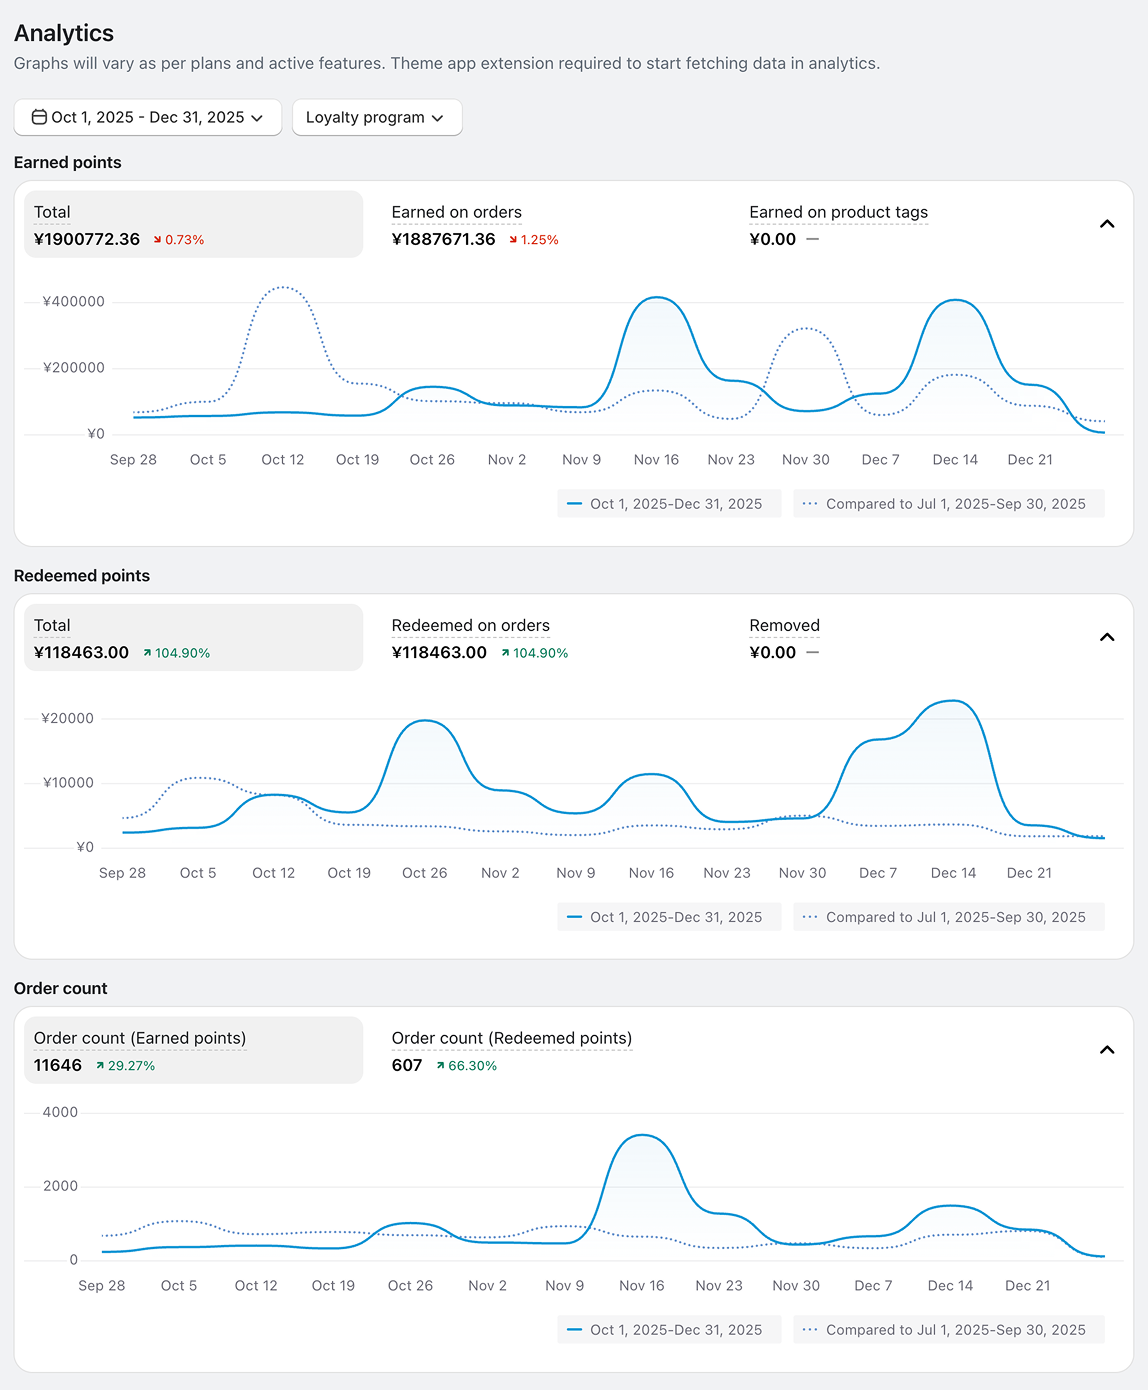
Source: Flits Loyalty Analytics
Oct 1–Dec 31, 2025 vs. Jul 1–Sep 30, 2025 (dashboard view shown for context)
Figures reflect a quarter-over-quarter comparison at daily granularity, not the exact monthly cut used in the table above, so totals may differ slightly (for example, 11,646 orders on the dashboard vs. 11,636 summed from the table).
October was a normal month for Asune's loyalty program, earning and redemption both running at a steady baseline. Then BFCM hit in November: earning orders more than doubled and order value jumped 134%, as expected during the year's biggest sale event. But redemption told a different story that month. With so many new and deal-driven shoppers in the mix, redemption activity actually dipped below October's level, since most of these customers hadn't built up enough points to spend yet.
December is where the payoff shows up. Earning activity settled back down from the BFCM peak, but redemption did the opposite: it climbed past both October and November to its highest point of the quarter, both in order count and value. The shoppers who earned points during BFCM came back the following month and used them.
Here's what the data tells you:
1. The program scaled with the BFCM surge without breaking
BFCM drove a sharp jump in loyalty activity:
Earning orders: 2,319 in October → 5,856 in November (+153%)
Earning order value: ¥26.9M in October → ¥63.1M in November (+134%)
Full quarter total: 11,636 earning orders and roughly ¥141M in tracked purchase value.
The program processed the surge without any drop in reliability at peak volume.
2. Redemption dipped during the rush, then rebounded past pre-BFCM levels
Redemption pulled back during the rush, then came back stronger than before:
Redemption orders: 203 in October → 156 in November (dip) → 249 in December (+59.6% vs November)
Redemption value: ¥1.86M in October → ¥1.28M in November (dip) → ¥1.96M in December, the highest of the quarter
Redemption rate: 8.75% of earning orders in October → 2.66% in November → 7.19% in December.
New and deal-driven BFCM shoppers hadn't built up points to spend in November. By December, customers who earned points during BFCM returned to redeem them, and engagement recovered close to its pre-BFCM baseline.
3. Returning December customers spent more per order
Order size grew even as volume fell back from the BFCM peak:
Average order value (earning transactions): roughly ¥11,600 in October → ¥14,750 in December
Total earning order count fell from the November peak, but December's order value stayed 90% above October's baseline.
The customers who came back in December weren't just deal hunters. They were spending more per visit than they had before BFCM started.
BFCM is usually measured by the spike size. Asune's data points to a more useful measure: what happens after the spike.
For a loyalty program running through a major sale event, this is the pattern to look for:
- Volume during the sale: earning orders and order value scale with the traffic surge
- Redemption after the sale: customers who earned points during BFCM come back to spend them
- Order value after the sale: returning customers spend more per order, not less
Asune's program cleared all three:
- The program absorbed a 2.5x jump in order volume during BFCM
- BFCM shoppers came back the following month to redeem points, rather than disappearing after a single discounted purchase
- December's average order value came in higher than October's, pre-BFCM baseline
The BFCM rebound also fits a broader trend. Across the full 2025 year:
- Redeemed points value grew 306.55% year over year
- Redemption order count grew 471.93% year over year
The BFCM rebound isn't an isolated event. It's part of a program that's driving more customers to return and redeem over time.